
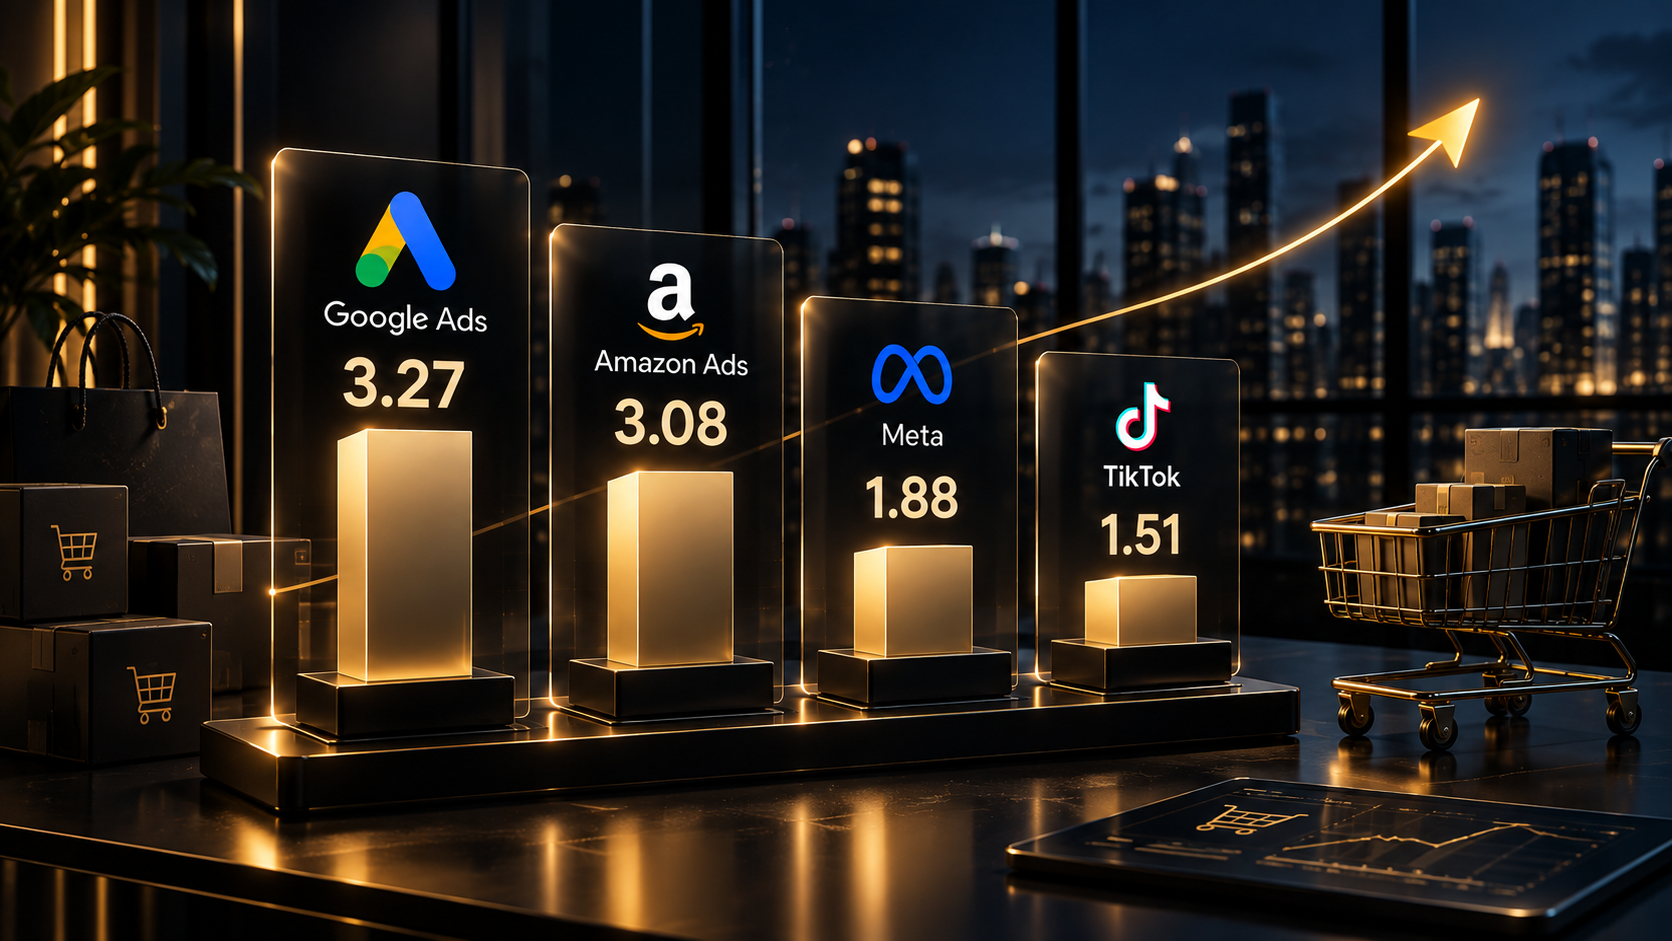
Google Ads produces the highest average return on ad spend for ecommerce stores at 3.27, followed by Amazon Ads at 3.08, Meta at 1.88 and TikTok at 1.51. Those four numbers come from one dataset over one period, so they compare fairly.
Digital ad ROI depends on your gross margin more than on the platform. Every ecommerce advertising platform charges roughly what the auction demands. The best ad platform for ecommerce is the one your margin can actually afford.
A store with 30% margin needs a 3.33 ROAS to break even. A store with 60% margin needs 1.67. Your margin decides the answer before any platform does.
Which Ad Platform Delivers the Highest ROAS for Ecommerce Right Now?
Google Ads leads on headline ROAS, and Amazon sits close behind it. Triple Whale published these ecommerce ROAS benchmarks covering August 1, 2025 to July 31, 2026. The figures come from brands running on its analytics platform.
| Platform | ROAS | CPA | CPM | Conversion rate | AOV | Brands measured |
|---|---|---|---|---|---|---|
| Google Ads | 3.27 | $28.14 | $15.35 | 3.11% | $87.65 | 21,000+ |
| Amazon Ads | 3.08 | $13.98 | $8.08 | 10.77% | $39.93 | 2,800+ |
| Meta | 1.88 | $38.99 | $15.06 | 1.53% | $73.36 | 40,000+ |
| TikTok | 1.51 | $17.07 | $4.08 | 1.56% | $50.32 | 5,900+ |
Three readings inside that table matter more than the ranking itself:
- Amazon converts at 10.77%, seven times Meta's 1.53%. Amazon catches shoppers at the checkout stage. Its CPM rose 39.18% year over year, the fastest cost inflation of the four.
- TikTok offers the cheapest traffic and the weakest returns. A $4.08 CPM looks attractive next to Meta's $15.06. Cheap clicks do not produce cheap customers.
- Google Ads got less efficient this year. Its ROAS fell 3.54% while its cost per acquisition climbed 9.96%.
Across all 53,000+ brands in the same dataset, the ecommerce conversion rate averaged 1.69% and the average order value reached $61.22.
Your category moves these numbers more than the platform does. On Meta alone, ROAS ranged from 2.35 in sports and outdoors down to 1.44 in health and wellness. Health and wellness advertisers paid $21.80 CPM against $11.50 for baby products.
Microsoft Ads, Pinterest Ads, Google Demand Gen and other retail media networks fill smaller roles for most stores. Test them after your primary paid media channel produces stable returns, not before.
Amazon advertising works differently from the rest. Sponsored Products reach shoppers who already opened a buying session, which explains the conversion gap.
Why Does Meta Take Two-Thirds of Ad Budgets With the Lowest ROAS?
Meta reports the weakest headline ROAS of the four platforms. It still collects 66.88% of total ad budget across those same brands, per Triple Whale. Two explanations hold up under testing.
The first is that Meta under-reports its own results. Haus ran 640 Meta incrementality testing experiments since early 2024. Those advertisers averaged $14 million in annual Meta spend.
- Meta drove roughly 19% average lift to brands' primary business metric.
- Meta under-reported incrementality by 15% on 7-day click attribution for direct-to-consumer sales.
- 32% of Meta's impact landed on channels outside the website for omnichannel brands.
Stella tested this separately between January and April 2025 across 46 brands earning $15M to $100M. Incremental ROAS averaged 2.87 against a platform-reported 2.37, an incrementality factor of 1.21. Meta produced 21% more incremental revenue than its dashboard claimed.
Haus found one result that contradicts standard advice about Meta's automation. Advantage+ campaigns over-reported by 12 percentage points against manual campaigns.
- 58% of brands recorded higher incremental ROAS on manual setups.
- Advantage+ averaged 12% lower incremental ROAS while spending 18% less per day.
Both studies used holdout tests rather than platform attribution. A geo holdout switches ads off in matched regions and measures the sales difference. That method produces numbers no attribution window can fake.
The second explanation cuts the other way. Google's 3.27 includes branded search, which captures demand the brand already created.
Tom Blake, Chris Nosko and Steven Tadelis tested this at eBay and published the result in Econometrica in 2015. Brand keyword ads produced no measurable short-term benefit when switched off. Frequent buyers, who absorbed most of the ad spend, bought anyway.
What ROAS Does Your Store Need to Break Even?
Break-even ROAS equals 1 divided by your gross margin. Run that against the platform averages above and the answer arrives in one table.
| Your gross margin | Break-even ROAS | Google (3.27) | Amazon (3.08) | Meta (1.88) | TikTok (1.51) |
|---|---|---|---|---|---|
| 70% | 1.43 | Profitable | Profitable | Profitable | Profitable |
| 60% | 1.67 | Profitable | Profitable | Profitable | Loss |
| 50% | 2.00 | Profitable | Profitable | Loss | Loss |
| 40% | 2.50 | Profitable | Profitable | Loss | Loss |
| 30% | 3.33 | Marginal | Loss | Loss | Loss |
| 20% | 5.00 | Loss | Loss | Loss | Loss |
A good ROAS for ecommerce is any number above your break-even line. Three figures fall out of that arithmetic:
- You need 53% gross margin to break even at Meta's average ROAS.
- You need 66% gross margin to break even at TikTok's average.
- You need 31% gross margin to break even at Google's average.
Check your margin before you compare platforms, if you want this decision to take ten minutes instead of three months.
Why Is Your ROAS High but Your Profit Still Low?
ROAS vs ROI is the distinction most ecommerce advertising comparisons skip. The two measure different things.
ROAS divides revenue by ad spend. ROI divides profit by total cost.
Total cost includes cost of goods, shipping, payment processing, returns, platform fees and the cost of running the ads themselves. A 4.0 ROAS on a product carrying a 25% gross margin loses money on every order.
Amazon's 3.08 ROAS carries a second problem. Amazon charges referral fees of roughly 8% to 15% depending on category, plus fulfilment costs when you use FBA.
Comparing Amazon's ROAS to Meta's without subtracting those fees overstates Amazon by a wide margin. Adjust for fees first, then compare.
Do Ad Platforms Report More Sales Than You Actually Made?
Ad platforms both overstate and understate, which is why your dashboard and your store never agree. Two things happen at once.
Platforms double-count against each other. Meta claims a sale, Google claims the same sale, and you add them together. Digital Applied reports that platform conversions summed across channels routinely exceed actual conversions by 150% to 300%.
Each platform undercounts in isolation. View-through conversions, cross-device journeys and iOS App Tracking Transparency all remove data the platform never sees. Hawky estimates real ROAS runs 20% to 30% above dashboard ROAS for this reason.
Both statements are correct. Platform reported numbers work for optimisation inside one account and fail as a cross-channel total.
Trust your blended ROAS and your marketing efficiency ratio over any single platform's attribution window. Marketing mix modeling handles this properly once monthly spend passes roughly $50,000.
Performance Max creates a version of the same problem inside Google. Dennis Moons at Store Growers documents Performance Max taking credit for branded search conversions. The campaign then looks strong without adding incremental revenue.
Google removed Performance Max from its Branded Searches measurement on August 18, 2026. It also cut the view-through window from 30 days to 7.
How Much Does the Platform Choice Actually Change Your Results?
Creative drives more of your results than the platform does. NCSolutions measured sales lift across nearly 450 campaigns and split the contribution five ways.
| Factor | Share of sales lift |
|---|---|
| Creative | 49% |
| Brand | 21% |
| Reach | 14% |
| Targeting | 11% |
| Recency | 5% |
Reach, targeting and recency add up to 30%. Your platform decision lives inside that 30%. Creative alone carries 49%.
Nielsen Catalina Solutions measured the same split in 2017 and also found creative at 49%. Brand rose from 15% to 21% between the two studies, while the media factors fell from 36% to 30%.
Pick the platform that fits your margin, then spend your energy on ad creative. That order produces better results than the reverse.
Are Ads Getting Too Expensive for Smaller Ecommerce Stores?
Ecommerce advertising costs have climbed steadily for a decade, and smaller stores feel it first. SimplicityDX puts the increase in customer acquisition cost at 222% across the past ten years.
The path shows up clearly in the yearly numbers Eightx compiled:
- 2015: $24 to $28 per customer
- 2020: $45 to $55 per customer
- 2021 to 2022: $60 to $80 per customer
- 2025 to 2026: $80 to $100 or higher
Meta CPM alone rose 89% since 2020. It climbed another 13.24% in the most recent year Triple Whale measured.
Average cost per acquisition across all ecommerce reached $23.20, up 5.1% year over year. Conversion rates fell 4.63% over the same period.
Rising ad costs and falling conversion rates squeeze from both sides. That combination explains why twelve of seventeen Meta verticals improved ROAS last year while twelve saw marketing efficiency ratio decline.
Smaller stores compete against advertisers with deeper testing budgets in the same auction. Focus on gross margin and average order value rather than matching competitor spend, if your budget sits below $5,000 a month.
What Does Ecommerce Advertising Cost in Canada?
Canadian advertising costs sit below the United States on Meta and above it on Google. Lebesgue benchmarked Meta CPM across 50 countries in July 2026. Canada came in at $11.47 USD against $16.08 in the United States, roughly 29% cheaper.
Google runs the other direction. Brand Butter, a Canadian agency, reports Canadian Google Ads costs running 8% to 22% higher than comparable US keywords. Ecommerce CPC there falls between $0.50 and $8 CAD.
Atlantic Canadian CPCs sit 20% to 40% below Toronto and Vancouver equivalents.
The market context matters for Canadian store owners. Statistics Canada put ecommerce at 5.7% of total Canadian retail in November 2025. That works out to C$4.0 billion of C$70.4 billion, released January 23, 2026.
That compares to roughly 16% in the United States and 26% in the United Kingdom. Lower penetration changes how much demand paid search can capture here.
American benchmarks mislead Canadian store owners for this reason. A digital marketing agency in Calgary reading Canadian numbers removes that source of bad budget decisions.
Penetration varies sharply by category. Electronics and appliances reached 31.9% online, clothing and accessories 19.0%, sporting goods 18.7% and furniture 13.0%.
How Much Should Your Store Spend on Ads Each Month?
Ad spend as a percentage of revenue falls as your store grows. Eightx compiled these bands from SEC filings for Allbirds, Warby Parker, Olaplex, BARK and Figs. Northbeam and Triple Whale data fill the rest.
| Revenue stage | Typical ad spend | Healthy range |
|---|---|---|
| Under $1M | 25-35% | 20-30% |
| $1M-$5M | 20-30% | 15-25% |
| $5M-$10M | 15-25% | 12-20% |
| $10M-$25M | 12-20% | 10-17% |
| $50M+ | 7-15% | 6-12% |
A marketing efficiency ratio between 3.0 and 5.0 reads as healthy. Below 2.5 usually means the business loses money at scale.
Small budgets face a problem nobody mentions in platform comparisons. Meta's Advantage+ needs roughly 50 conversion events per week to exit the learning phase. Google Smart Bidding wants 30 or more conversions per month.
A store producing 20 orders a month cannot generate a readable signal on either platform. Run one platform properly rather than splitting a minimum ad budget across two. Brand Butter puts early-stage Canadian ecommerce budgets between $3,000 and $8,000 monthly for Calgary, Toronto and Vancouver advertisers.
Which Platform Brings Customers Who Buy Again?
Customer acquisition cost differs by channel more than ROAS suggests. Customer lifetime value, not first-order revenue, decides real profitability. Eightx analysed roughly 40 brands earning $2M to $130M and reported these ranges.
- Paid search (Google Ads): $50 to $130 per customer
- TikTok: $90 to $129 per customer
- Meta: $212 to $230 per customer
- Referral programs: $40 to $65 per customer
- Email and SMS: near-zero marginal cost
CAC payback period varies by category:
- Food and beverage: 1 to 3 months
- Beauty and pet care: 2 to 4 months
- Fashion and apparel: 3 to 6 months
- Electronics: 6 to 12 months or longer
The LTV to CAC ratio everyone quotes is 3:1, sourced to Shopify. Eightx found most scaling brands running between 1.5x and 2.5x. Treat 3:1 as a target, not a benchmark you already hit.
Owned channels change the maths. Klaviyo measured 183,000+ accounts and found flows carrying the revenue.
Email flows generated roughly 41% of total email revenue from 5.3% of send volume. Flows also placed orders at 13 times the rate of campaigns.
Fix your flows before you raise your paid budget, if your abandoned cart and post-purchase sequences are not live yet.
Is AI Search Traffic Worth Chasing Yet?
AI referral traffic converts better than organic search and still produces about 2% of revenue. Visibility Labs tracked 94 ecommerce sites across all of 2025 and published the comparison in February 2026.
| Metric | ChatGPT referrals | Non-branded organic |
|---|---|---|
| Conversion rate | 1.81% | 1.39% |
| Average order value | $204 | $238 |
| Revenue per session | $3.65 | $3.30 |
ChatGPT traffic converted 31% higher and produced 10.3% more revenue per session. Visits grew 1,079% across 2025 while non-branded organic grew 17%.
The volume tells the other half. Non-branded organic sessions ran 70 times larger. ChatGPT accounted for 1.48% of revenue across the year, rising to 2.2% in the second half.
Treat AI search as a measurement problem this year and a budget line next year. Around 70.6% of AI referrals land in analytics as direct traffic. Most stores cannot see the channel they already have.
Should You Run Your Own Ads or Hire Someone to Manage Them?
Run your own ads while monthly spend stays under roughly $3,000. Bring in help once conversion tracking and attribution become the bottleneck. The decision turns on which problem is costing you more.
Platform setup has become easier. Advantage+ and Performance Max handle bidding and placement automatically. Google Merchant Center feeds most of what Shopping campaigns need.
The parts that still break are the ones outside the ad account:
- Conversion tracking that misreports sales and trains the algorithm on bad data
- Server-side tracking through the Conversions API, which most stores never set up
- Blended reporting that reconciles Meta, Google and your store into one number
- Creative volume, given creative carries 49% of your result
A store spending $2,000 monthly cannot justify a management fee against those gains. A store spending $15,000 monthly with broken attribution loses more than the fee every month.
Our Google Ads and Meta Ads management work starts with tracking and margin maths before any campaign gets rebuilt. Bad data costs more than bad bidding.
How Do You Choose the Right Ad Platform for Your Store?
Match the platform to four numbers you already own: gross margin, average order value, monthly order volume and whether demand for your product already exists.
- Choose Google Ads if people already search for your product category and your margin clears 31%. Google Shopping and Performance Max capture existing demand.
- Choose Meta if your product needs explaining or discovery, and your margin clears 53%. Meta creates demand rather than catching it.
- Choose Amazon Ads if you already sell on Amazon and your category referral fee leaves room after a 3.08 ROAS.
- Choose TikTok Ads only if your margin clears 66% and your product suits short video. Apparel and accessories reached 2.70 ROAS on TikTok against the 1.51 platform average.
Run one platform until it produces 50 conversions weekly before adding a second. Splitting a small budget across two platforms delays learning on both.
Budget allocation between platforms matters less than most comparison articles suggest. Get one channel profitable, then let its ceiling decide when you expand.
The team at Aurixlab builds ad accounts around break-even ROAS and blended marketing efficiency, not dashboard ROAS. Book a review if your ad numbers look strong and your bank balance does not.
FAQs Owners Ask About Ad Platform ROI
Which Platform Has Better ROAS for Ecommerce?
Google Ads averages 3.27 ROAS against Meta's 1.88, Amazon's 3.08 and TikTok's 1.51. Triple Whale measured this across nearly 70,000 brands between August 2025 and July 2026. Google's figure includes branded search, which captures demand your brand already created.
Why Is My ROAS High but My Store Still Unprofitable?
Break-even ROAS equals 1 divided by your gross margin. A store with 30% margin needs 3.33 ROAS to cover product cost alone. Shipping, returns, payment processing and management fees push the real break-even number higher than the platform reports.
How Much Should a Small Ecommerce Store Spend on Ads Monthly?
Stores under $1 million in revenue typically spend 25% to 35% of revenue on ads, with 20% to 30% counting as healthy. Canadian ecommerce advertisers starting out budget $3,000 to $8,000 monthly in major markets, per Brand Butter's 2026 figures.
Why Do My Ad Platform Numbers Not Match My Shopify Revenue?
Platforms double-count against each other, inflating summed conversions by 150% to 300%. Each platform separately undercounts view-through and cross-device sales, pushing real ROAS 20% to 30% above dashboard figures. Use blended ROAS and marketing efficiency ratio instead.
Should I Start With Google Ads or Facebook Ads?
Start with Google Ads if shoppers already search for your product and your gross margin clears 31%. Start with Meta if your product needs demonstration and your margin clears 53%. Run one platform to 50 weekly conversions before adding the second.